728x90
반응형
[소스코드]
# libraries & dataset
import seaborn as sns
import matplotlib.pyplot as plt
import pandas as pd
tmp_df = sns.load_dataset('mpg')
print(tmp_df.head(3))
# Select numerical columns from dataset
numerics = ['int16', 'int32', 'int64', 'float16', 'float32', 'float64']
num_df = tmp_df.select_dtypes(include=numerics)
# fig setting
sns.set(rc = {'figure.figsize':(5, 3)})
sns.set(style="whitegrid")
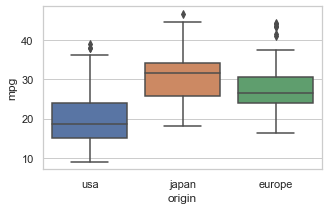
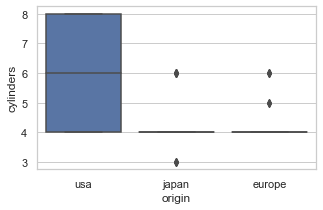
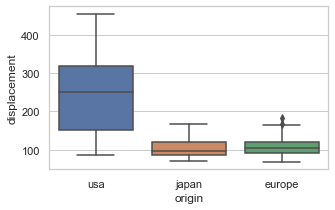
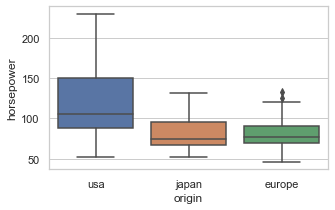
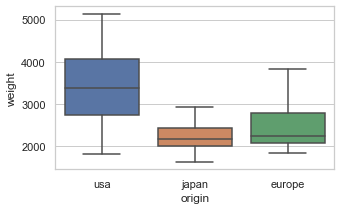
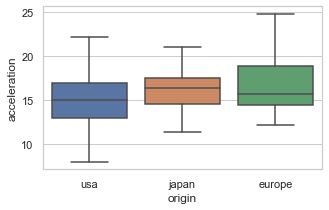
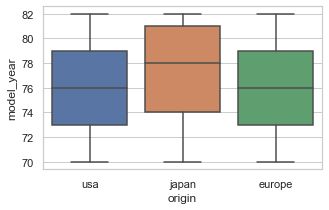
# numerical col selection & plotting boxplot by group
### ex> 'origin' : usa/japan/europe
for n_col in num_df.columns:
sns.boxplot(y=n_col, x='origin', data=tmp_df)
plt.show()
[실행 결과]
  mpg  cylinders  displacement  horsepower  weight  acceleration  \
0  18.0          8         307.0       130.0    3504          12.0
1  15.0          8         350.0       165.0    3693          11.5
2  18.0          8         318.0       150.0    3436          11.0

   model_year origin                       name
0          70    usa  chevrolet chevelle malibu
1          70    usa          buick skylark 320
2          70    usa         plymouth satellite
반응형
'Data Analysis > visualization' 카테고리의 다른 글
| [번역] 모든 데이터 과학자가 시각화 툴킷에 추가해야 하는 8가지 대안 (0) | 2023.11.22 |
|---|---|
| [python] 데이터프레임에서 수치형 컬럼 자동 선택 후 히스토그램 한 판에 그리기! (feat. seaborn) (0) | 2022.04.26 |
| [Python] y축 2개를 이용한 산점도 + 추세선 그리기(그룹별 색상 옵션 추가) (0) | 2022.02.11 |
| [Python] y축 2개를 이용한 산점도 + 추세선 그리기(&그룹별 색상) (0) | 2022.02.10 |
| [Python] 산점도 : 2개의 변수 간 분포 확인을 위한 시각화 방법(한눈에 들어오는 예제 코드 포함) (0) | 2022.01.27 |


